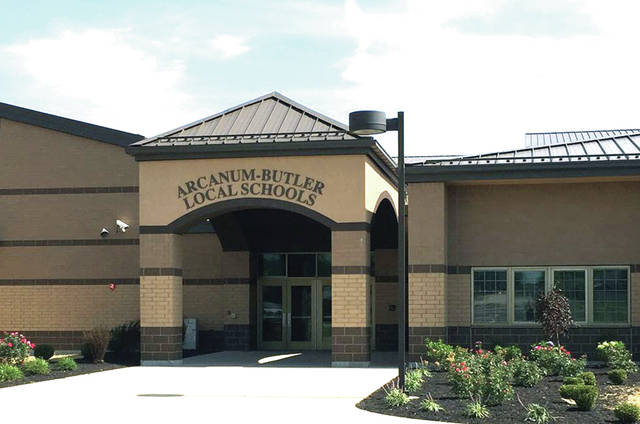

ARCANUM — The release of the annual Ohio School Report Cards by the Ohio Department of Education (ODE) brings comments from county administrators.
While schools and districts have received A-F letter grades on “Indicators Met” and “Performance Index” for several years, something new this year was the increase in the percent of students needing to score proficient or higher on each state test. Despite the increased rigor of an 80 percent passing rate, Arcanum-Butler Superintendent John Stephens said, overall, the district was able to either maintain the same grade or improve.
“While ‘pleased’ may not be the appropriate term, we do believe we have areas to be proud of,” he said. “The most pleasing grade is that of the “Progress” measure that shows our students making more than a year’s growth. Our middle school building for example had all A’s in every Progress measure. I’m also pleased that we saw an improvement in the K-3 Literacy measure, as we increased a letter grade on that measure.”
In addition, Arcanum-Butler ranked 28 out of 275 in a comparison group of schools ranking the percentage of funds used for classroom instruction. The district spent 71 percent of funds on classroom instruction. Arcanum-Butler summary of report card components and grades are as follows, including comments from Supt. Stephens:
Achievement – GRADE: C (Last year’s result C)
Represents whether student performance on state tests met established thresholds and how well students performed on tests overall. The percentage threshold was increased to 80 percent. The district met 9/23 test indicators and received 93.8 points on the performance index that is calculated based on students’ level of scoring. While the district met fewer indicators this year, the performance index increased from last year.
Gap Closing – GRADE: F (Last year’s result F)
Shows how well schools are meeting the performance expectations for various populations of students in English language arts, math and graduation, with the idea that the various populations or groups “close the gap” of an established performance threshold.
K-3 Literacy – GRADE: C (Last year’s result D)
Looks at how successful the school is at getting struggling readers on track to proficiency from year to year in grades K, 1, 2 and 3. The literacy component only looks at students who are “at-risk”, and does not factor in students meeting or exceeding literacy expectations.
Progress – GRADE: A (Last year’s result A)
Looks closely at the growth that all students are making based on their past performances. An “A” indicates that the student population as a whole made more than one year’s growth. A grade of a C indicates students made one year’s growth.
Graduation Rate – GRADE: A (Last year’s result A)
Looks at the percent of students who are successfully finishing high school with a diploma in four or five years. The district had a 4-year graduation rate of 98 percent, and a five-year graduation rate of 100 percent.
Prepared for Success – GRADE: D (Last year’s result D)
Whether training in a technical field or preparing for work or college, this component looks at how well prepared students are for future opportunities. Over half of the 2016 graduating class received dual enrollment credits through the College Credit Plus program.
Gifted – GRADE: NOT MET (Last year’s result MET)
The gifted component on the grade card includes scores for Gifted Value Added (Growth), Performance Index and Inputs. The district MET expectations on the value-added measure, but did not meet the thresholds for “MET” on the other two measures.
“Our district leadership team is meeting to take a more in-depth look at the report card to determine what positive and negative trends might exist on the report cards in the last three years,” Stephens said. “This year, we are able to obtain item analysis of most of the tested areas, allowing a closer look at specific areas/content on the tests. While informative, the district recognizes that many of the report card indicators are based on tests given on a specific day, during a specific time and may not provide the entire picture of a child’s learning experience nor does it define the district as a whole. I am proud of our students and staff for their continued efforts and accomplishments. We will continue to seek growth and improvement in providing the best experience for students and preparing students for college and careers.”


